
Brief
Attentive mobile is a text marketing platform that enables brands across a number of industries to communicate more effectively with their customers through personalized text messages. To do this, marketers need to access data about their list of subscribed customers so that they can target these audiences with text messages based on their attributes and behaviors. In the industry, audiences grouped by attributes and/or activity are called segments. This project was an effort to establish the mission and vision of a newly formed team, called Targeting, which would serve as the umbrella for multiple data products teams, including segmentation, and would work to surface data more effectively across several feature teams at Attentive and establish key differentiators between Attentive and its competitors.
Team: Kelly Jacobs (Product design lead), Luzy Zhong (Product lead), Jess Watson (Product design), Torin Chichirico (Engineering lead)
Timeline: We spent 2 months on initial research and design concepts, and work towards long term vision is still ongoing
Keywords: Users = Attentive clients; Customers = customers of Attentive clients; segments = sets of customers that are saved in Attentive based on attributes and/or activity
Challenge
Attentive was in a high growth stage, when it’s headcount went from 250 - 600 people in 6 months. The product, design, and engineering organization quickly outgrew its processes, and teams were operating in silos. These silos created redundant and inefficient workflows for enabling customer data across different feature teams as well as inconsistent UX across the product. Additionally, Attentive’s segmentation capabilities were behind most of its competitors which was a constant source of churn for clients.
Opportunity
The big opportunity with this work was to partner closely with my counterparts across product, engineering, product marketing, and account management to establish a product vision and UX northstar for this newly formed team which would be responsible for how clients leverage customer data in Attentive. The targeting team would serve as the owner for enabling feature teams to access customer data in a consistent way and as the subject matter expert for how Attentive clients would access and use customer data across the UI in new and differentiated ways.
From a design perspective, the opportunity with this new direction was two fold:
1) build user trust with how data is calculated and 2) drive understanding with segment performance so that users can decide how to evolve their messaging strategy.
Skillset
User research, interview facilitation, competitive analysis, affinity mapping, prototyping, usability testing, information architecture, lo-fidelity and high-fidelity design
Toolset
Miro, figma, notion, zoom
Mindset
“Design is never done” - Luke Wroblewski
Discover
Developing a deep understanding of user needs
The first and most important step in establishing the team mission and product vision was to develop a deep understanding of the internal and external user needs for customer data in the product. Working closely with my product partner, Nikhil, I identified primary research questions we needed answer in order to inform our product vision.
Our primary research questions
What are the most important needs our clients have when it comes to using customer data? What are the biggest challenges they have when using customer data to achieve their goals? What are the most important use cases for this data, and how can we address them? What kinds of customer data are most important to source, process, and expose?
How are clients currently solving these problems (using Attentive, or otherwise)? What existing products in the market attempt to address these customer problems? Are clients using Customer Data Platforms? Why?
What are the most important needs and goals of our internal stakeholders? What are the biggest needs across the company? How should we work with other teams? What short-term projects depend on us? What ambitious problems can we help solve? What is most important to build or de-risk first? What might an MVP look like for Q1 2021?
Methodology
Competitive analyses. I analyzed the functionality and design of products in this problem space, in order to inform how we approached our qualitative interviews. In tandem, Nikhil conducted a market analysis of these products and other competitors.
Lots and lots of listening and co-designing. I led interviews with clients across a variety of sizes and industries to understand how marketers using Attentive are using customer data to achieve their goals and identify their biggest pain points. During these calls, we prompted participants to sketch out their ideal UX when interacting with customer data in the Attentive product.
10
client interviews
11
stakeholder interviews
Affinity mapping. In order to synthesize all the things we heard in interviews, I used affinity mapping to help me identify high level patterns around the goals and needs of our clients.
The affinity map I developed to synthesize key takeaways from interviews. View the full analysis here.
Clients’ needs around customer data are highly varied, nuanced, and complex, but they all follow a similar workflow.
Needs we heard from clients
“I need a comprehensive way to consolidate and access my customer data”
Whether it be through plugging in their CDP (customer data platform) or importing reports, clients need to bring all of the data about their customers, over time and channels, into one place and easily access it for analysis.
“I need to analyze this data to understand behaviors”
When it comes to answering questions about their customers, client needs were highly variable, but some common themes stood out: They needed to measure and monitor segment performance and analyze customer data in aggregate. They needed more immediate understanding of message performance, how a first time customer turns into a returning customer, what the customer journey looks like, benchmarks, and more immediate understanding of ROI.
“I need to evolve my messaging strategy based on key findings”
Clients need to use the output of their analysis to inform how they plan and execute their strategy to drive a better outcome. Common questions included, "How can I upsell or cross-sell as it relates to upcoming product launches?", "How can I experiment with different timing and content?", "How can I implement orchestrated engagement effectively?"
“I need to execute my engagement strategy in Attentive”
Based on their strategy, clients need ability to send timely and relevant messages and set up effective creatives.
When thinking about using customer data, clients think about running a search
In interviews and during co-design sessions, it was clear that clients use a saved search mental model to describe how they access data about their customers. “I enter these parameters, hit search, and then results are returned.”
A marketer's workflow
What stood out was that these needs are not specific to segmentation. Rather, they touch every single aspect of the Attentive platform, including message creation, reporting, and integrations.
While we gained a deeper understanding of what we needed to solve for our customers, this framework helped us recognize the cross functional nature of supporting client needs around customer data in the Attentive platform.
I summarized key takeaways from client calls which can be found here.
Needs we heard from Attentive stakeholders
Provide a central repository for all information about customers.
Providing a scalable, flexible, and efficiency API for internal teams to funnel customer data into their feature sets was a critical need. Teams need to access this data from the macro level all the way down to the micro level. Additionally, account support teams needed better visibility into customer data in order to help clients troubleshoot issues.
Support different types of customer data
Internal teams had use cases for two different types of customer data: Attributes and activity. Attributes are descriptive or predicted traits about a customer, such as age or preferences. Activity is data about past behavior, such as ‘customers who have purchased red shirts’.
Don’t just provide the data, help us understand what to do with it
Attentive teams don’t just want the raw customer data, there was also a great need for a recommendation engine to start enabling clients to take the right next step in their messaging strategy.
Ensure data quality
There was no owner of data quality, which was a huge pain point for all feature teams. Our new team would need to serve as the gate for ensuring quality across customer data being used in the product.
Internal stakeholders called out the need to view customer data at the micro level as a way to ‘get credit’ for all of the data that Attentive offers; however, clients never brought up this use case.
Ideation
Translating insights into action
The findings from these interviews resulted in a re-org of our team that brought segmentation and customer data platform teams under one roof, called Targeting. We were no longer just the segmentation team. With this alignment, infrastructure and workflows could be centralized and optimized to better serve the business.
Jess and I consolidated these insights, competitor research, and additional usability research led by Jess to inform our ideation on a new northstar for the segmentation UI and other areas where data might be surfaced.
Because we wanted to pivot to a search mental model, I decided to focus on steps 2, 3, and 4 of our clients’ workflow
After some iteration, I landed on 3 new initiatives for a re-imagined segmentation experience (aka our new northstar).
Segment builder redesign
In order to support more data in our segment builder, we would need to redesign the information architecture of the dropdowns to ensure discoverability and learnability of data conditions. The original dropdown had 26 options, with more on the way. Additionally, we needed to shift this experience closer to a search workflow, by removing the 3 steps and creating a modular experience with real time results that could be accessed anywhere in our product.
Pivot segment details to segment insights
In the workflow I discovered through affinity mapping, clients first need to understand performance and then evolve their strategy based on insights. Therefore, our segment tab needed to display more actionable, performance data that would help our users decide on next steps.
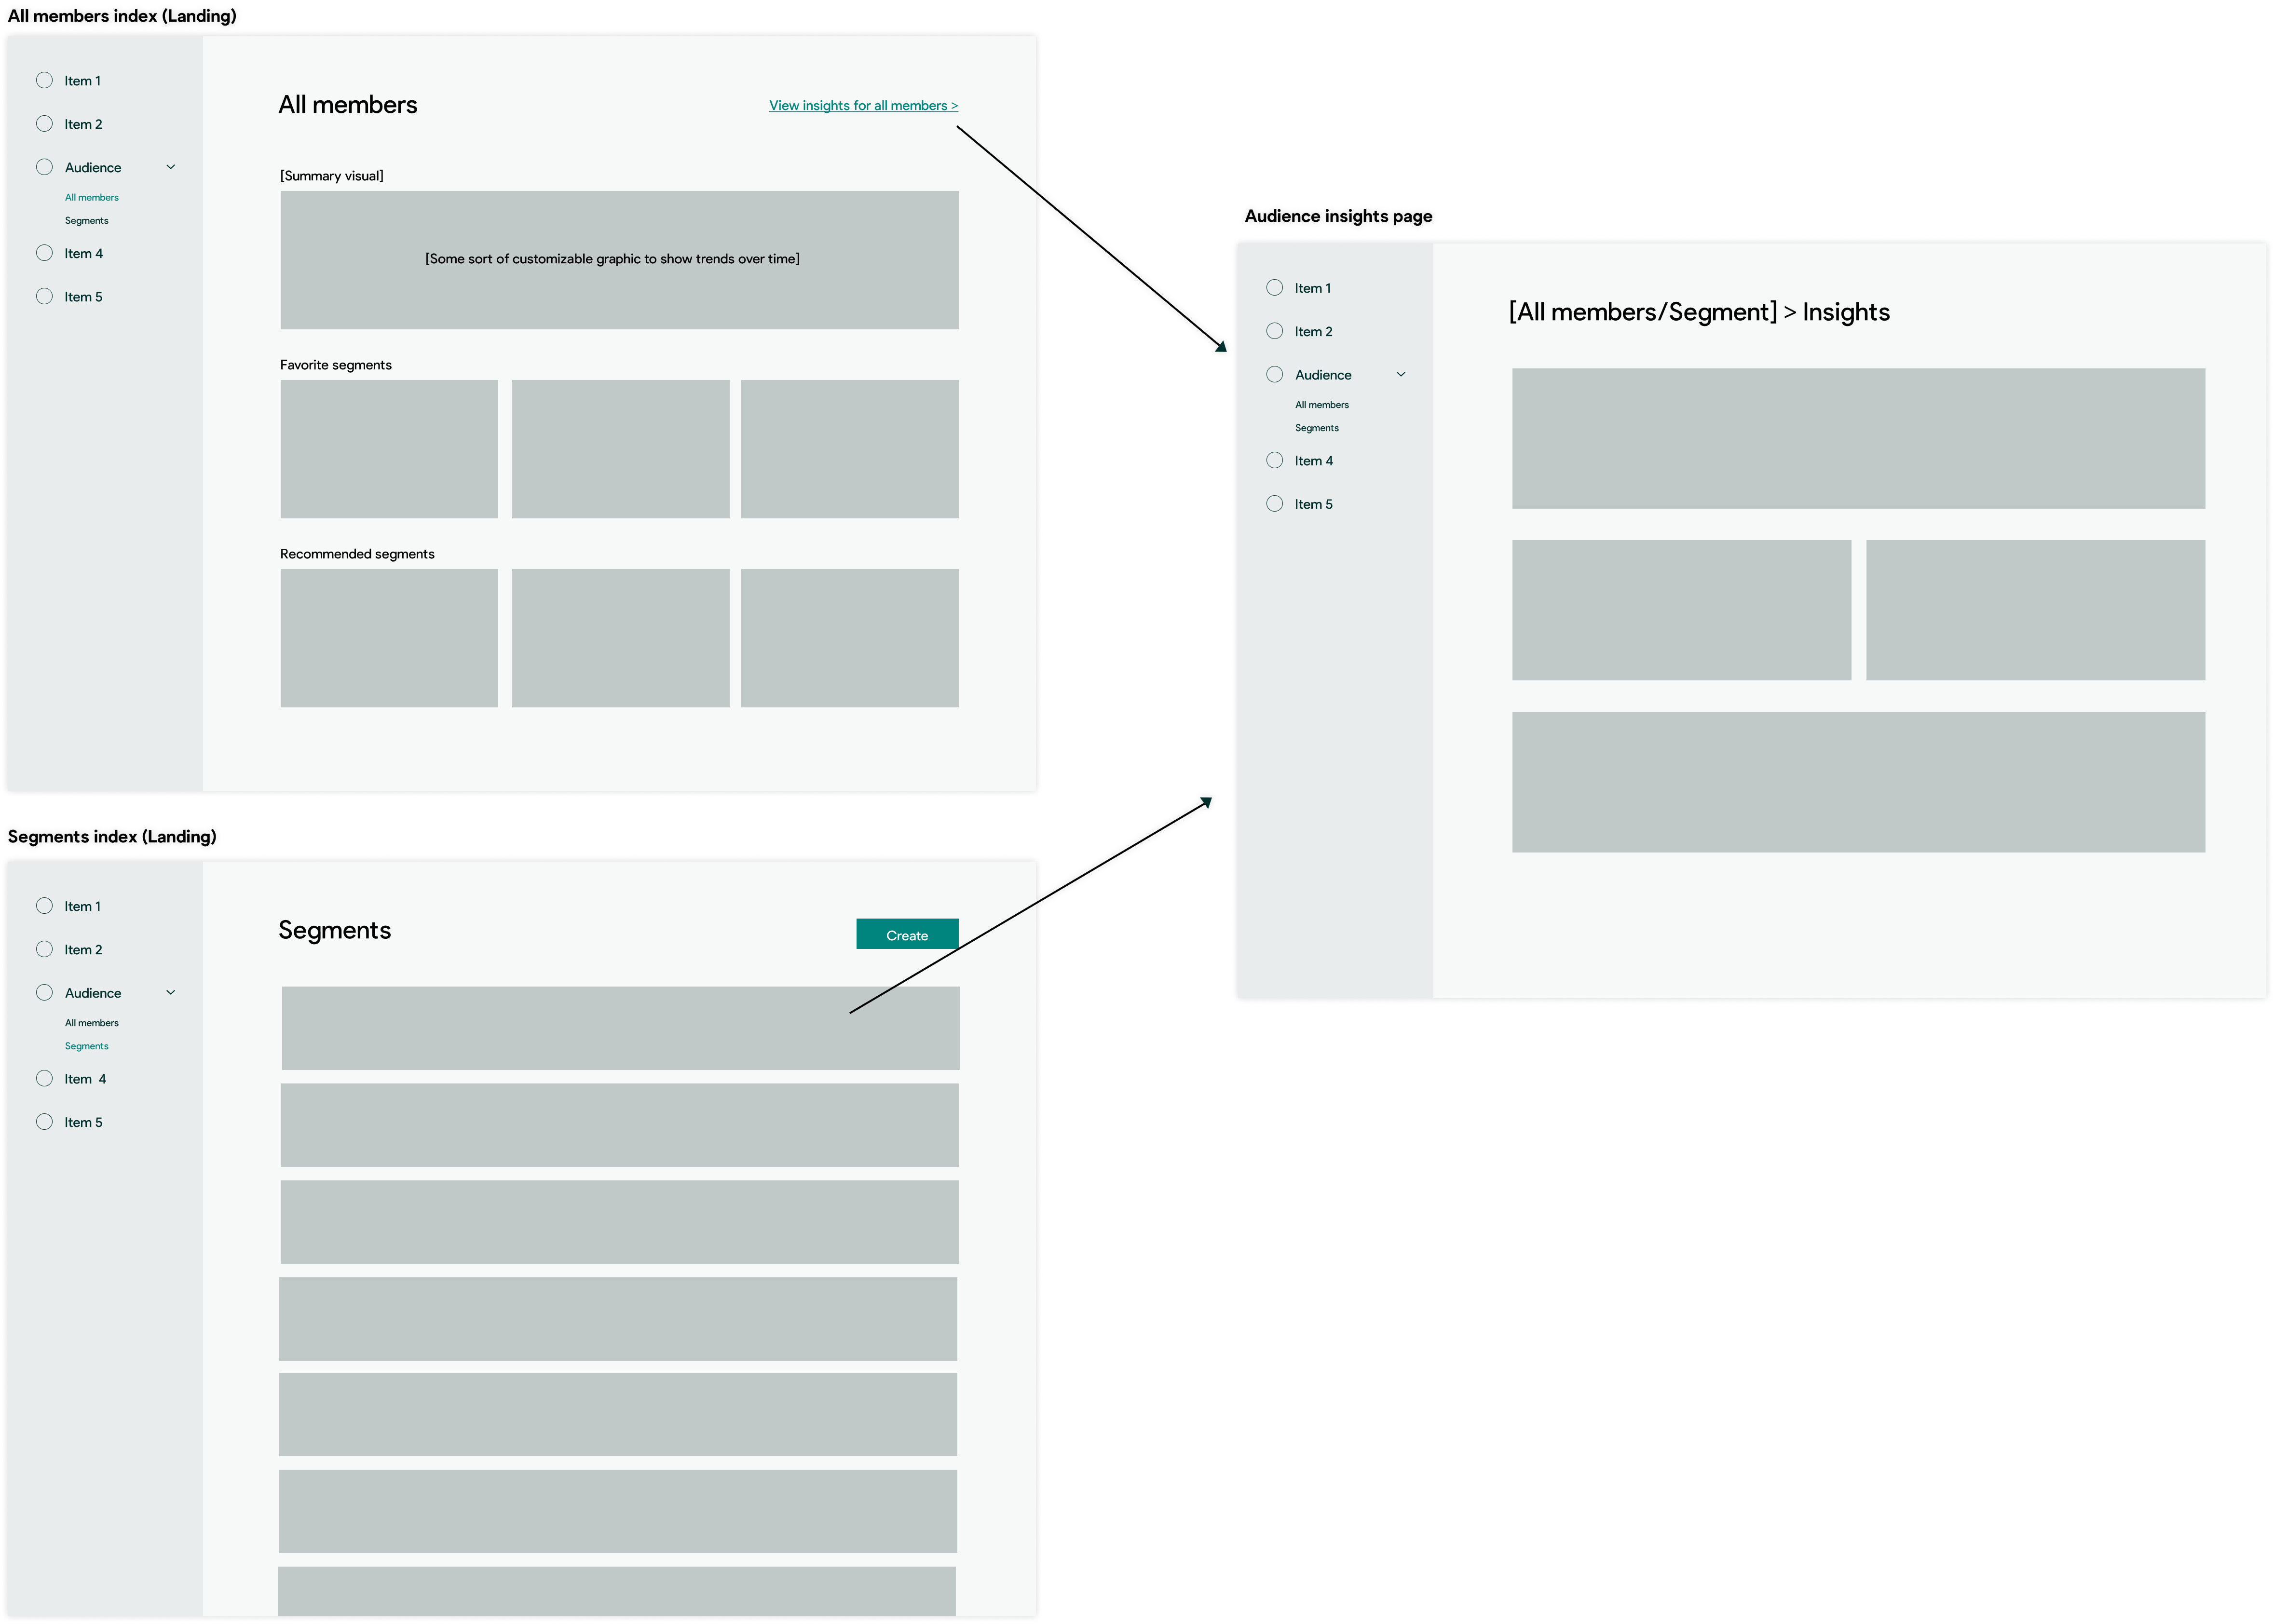
Create an audience overview page
This overview page would serve as a homebase for everything about your audience, including segments, and provide an aggregate view of performance. From here, users could monitor the value and health of their list or drill down to a specific segment. In other products, I discovered that competitors usually just display a flat list of all subscribers, which provides little to no value to users. Therefore, an aggregate view of performance would serve as a key differentiator for Attentive.
To get our cross functional team on board with this new direction, I presented a summary of our key research findings, while linking those findings to the low-fidelity concepts Jess and I developed as our new UX northstar.
Our cross functional team was aligned on where we wanted to go, but it would be an uphill battle to get alignment with leadership. We succeeded in pushing for some initiatives, but failed for others.
I worked closely with my product partner, Lucy, to break these initiatives down into projects and get them prioritized.
Design
Advocating, delegating, delivering
To deliver value to users faster, we broke these initiatives down into smaller projects and I delegated them between myself and Jess. Then, we got to work.
These projects each solved different sets of user problems and required their own set of UX thinking and research that could each take an entire case study to explain. Therefore, I’ll touch lightly on each project and highlight how it contributed to the overhaul of the segmentation experience as a whole.
Segments overview, a redesign
Owner: Kelly Jacobs
Timeline: One month
The gist of this project was simple: change the UI for viewing and managing saved segments from a card view to table view. Through research, I saw how users do mental math with segment size and other data points like return on investment (ROI) and click through rate (CTR) to determine which segment they should send a message to. At a high level, this type of UX would enable the necessary real estate to surface more valuable performance data earlier in the experience. With a table, we could incrementally add more data with little to no design lift. Potentially allow users to customize the table? Definitely. Additionally, more tooltips would help educate users on how different data is calculated.
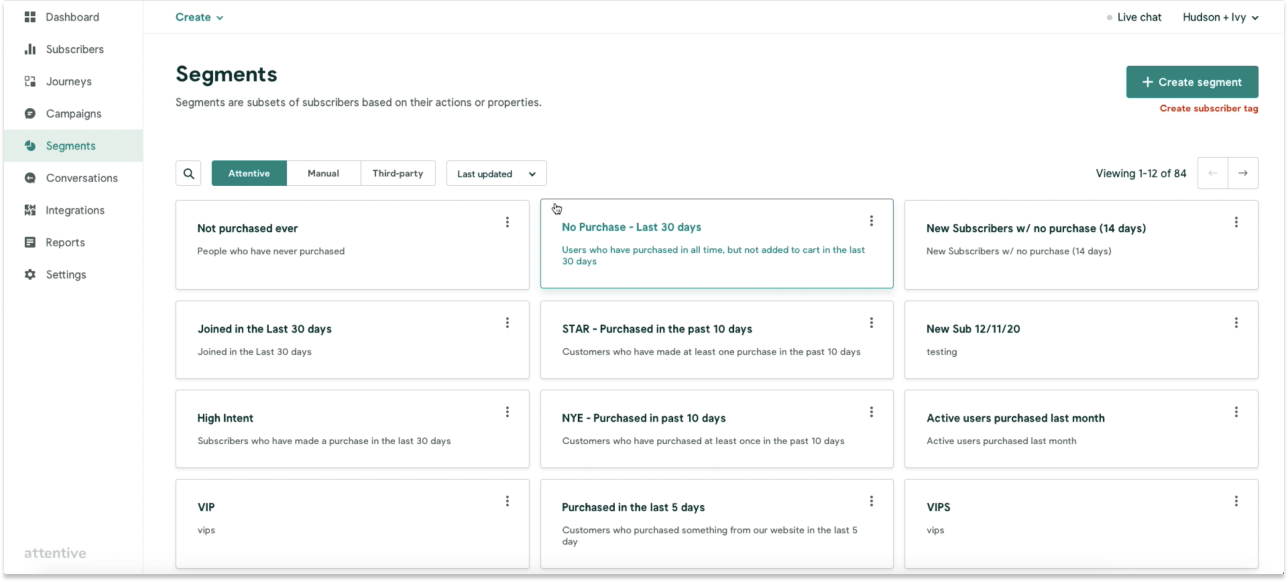
The original design of the segments overview page
My design choices were informed by our northstar, and they also addressed several usability issues that Jess found in her aftercare research
Organizing segments by type made them harder to discover. Jess tested the experience for creating a segment through an integration or through a CSV upload on clients. When they navigated to this page to find it, they often missed or misunderstood the tabs at the top of the table and were unable to find the segment they had just created. They relied heavily on the title search to find their recently created segment.
A large grid of cards is harder to scan. Anecdotally, we learned from clients that they were often managing many segments (>10 segments) at a time in other email tools. Assuming clients would eventually start to build more segments in Attentive, a table layout would make it easier to scan a much longer list of segments.
3rd party segment creation was difficult to find. Most users were unable to find where they could connect a segment from a 3rd party tool, which was located in a completely separate tab. I needed to create a pathway to this flow within the context of segments to reduce friction.
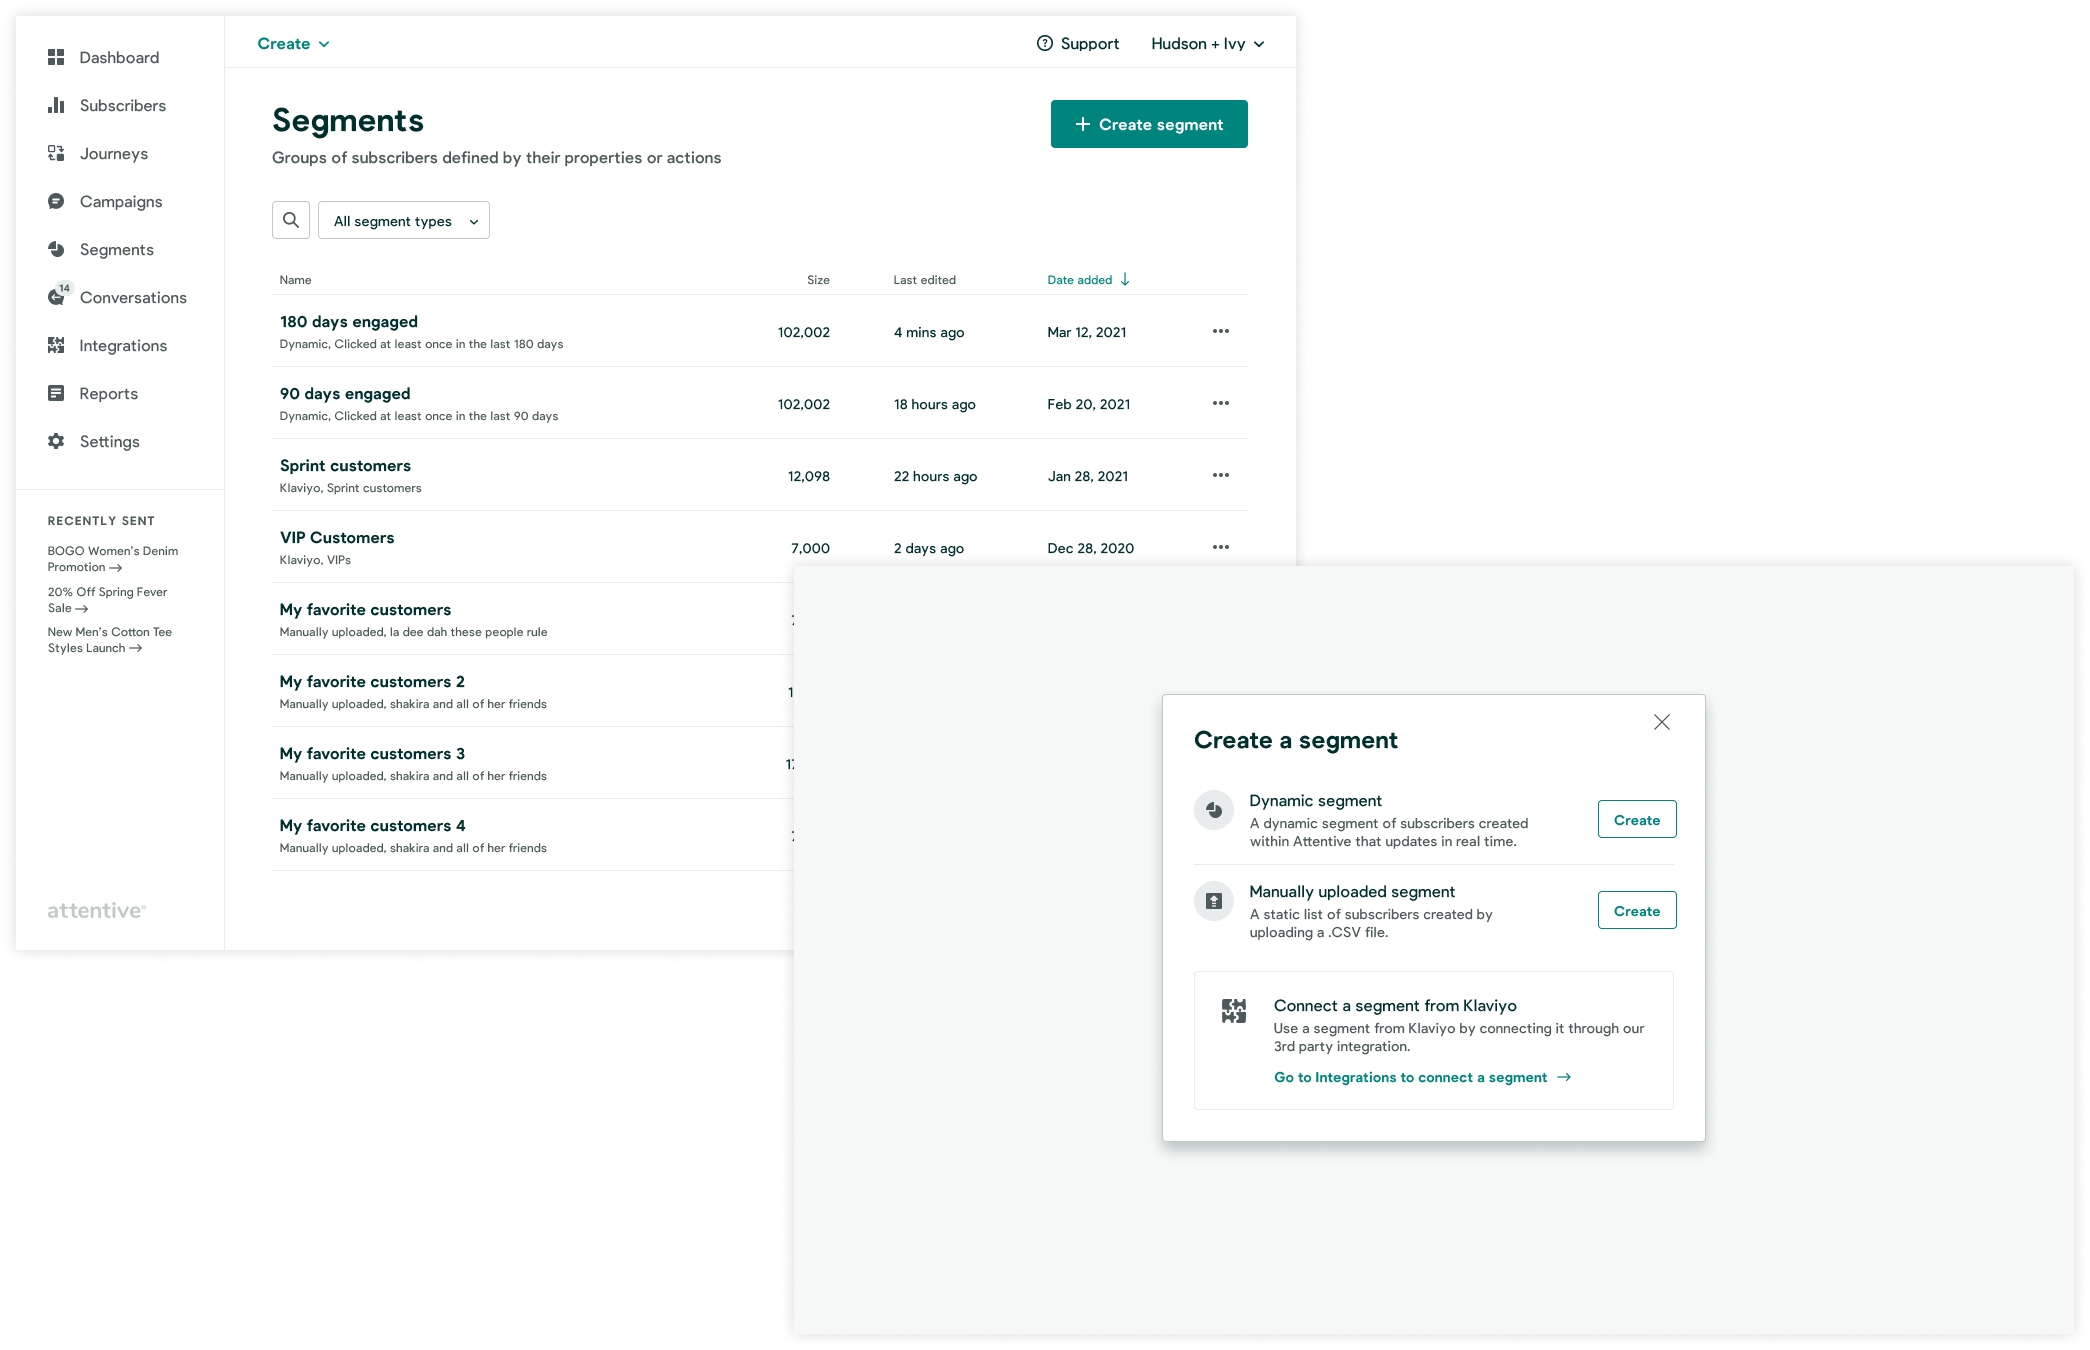
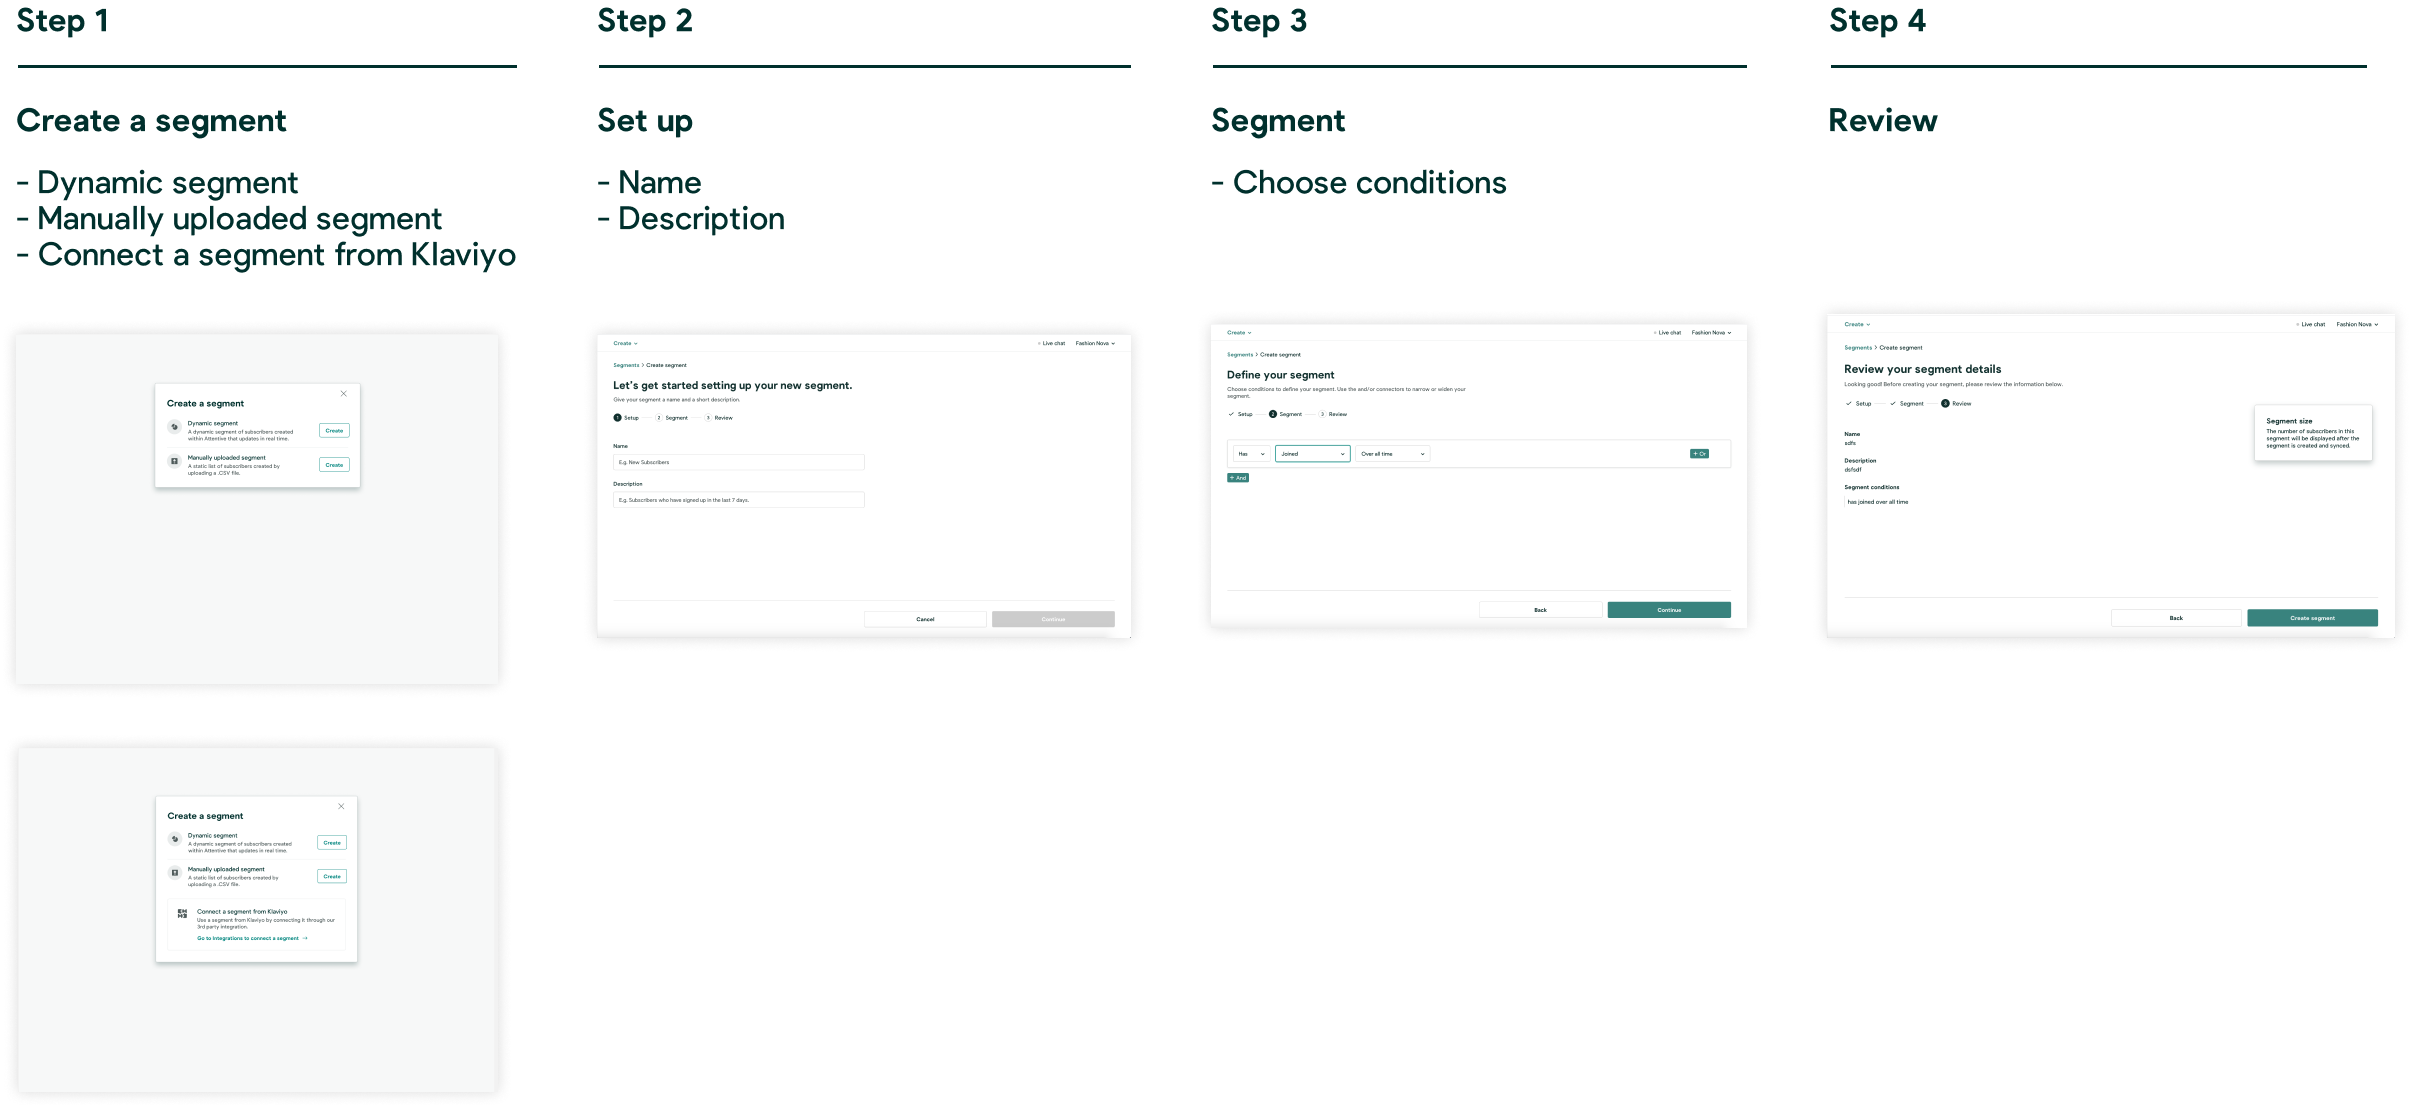
High fidelity designs of the new segments overview and creation experience
Right after this project was released, our design system got a major face lift .
.
Segment builder information architecture
Owner: Jess Watson
Timeline: 3 months
This was a very complex, UX heavy project in which Jess re-imagined how users find and use different data conditions to build segments for targeting different audiences. From our research, we knew that the amount of data we would offer for segmentation would only increase, and the single dropdown that listed all of the different data conditions would only become more difficult to use.
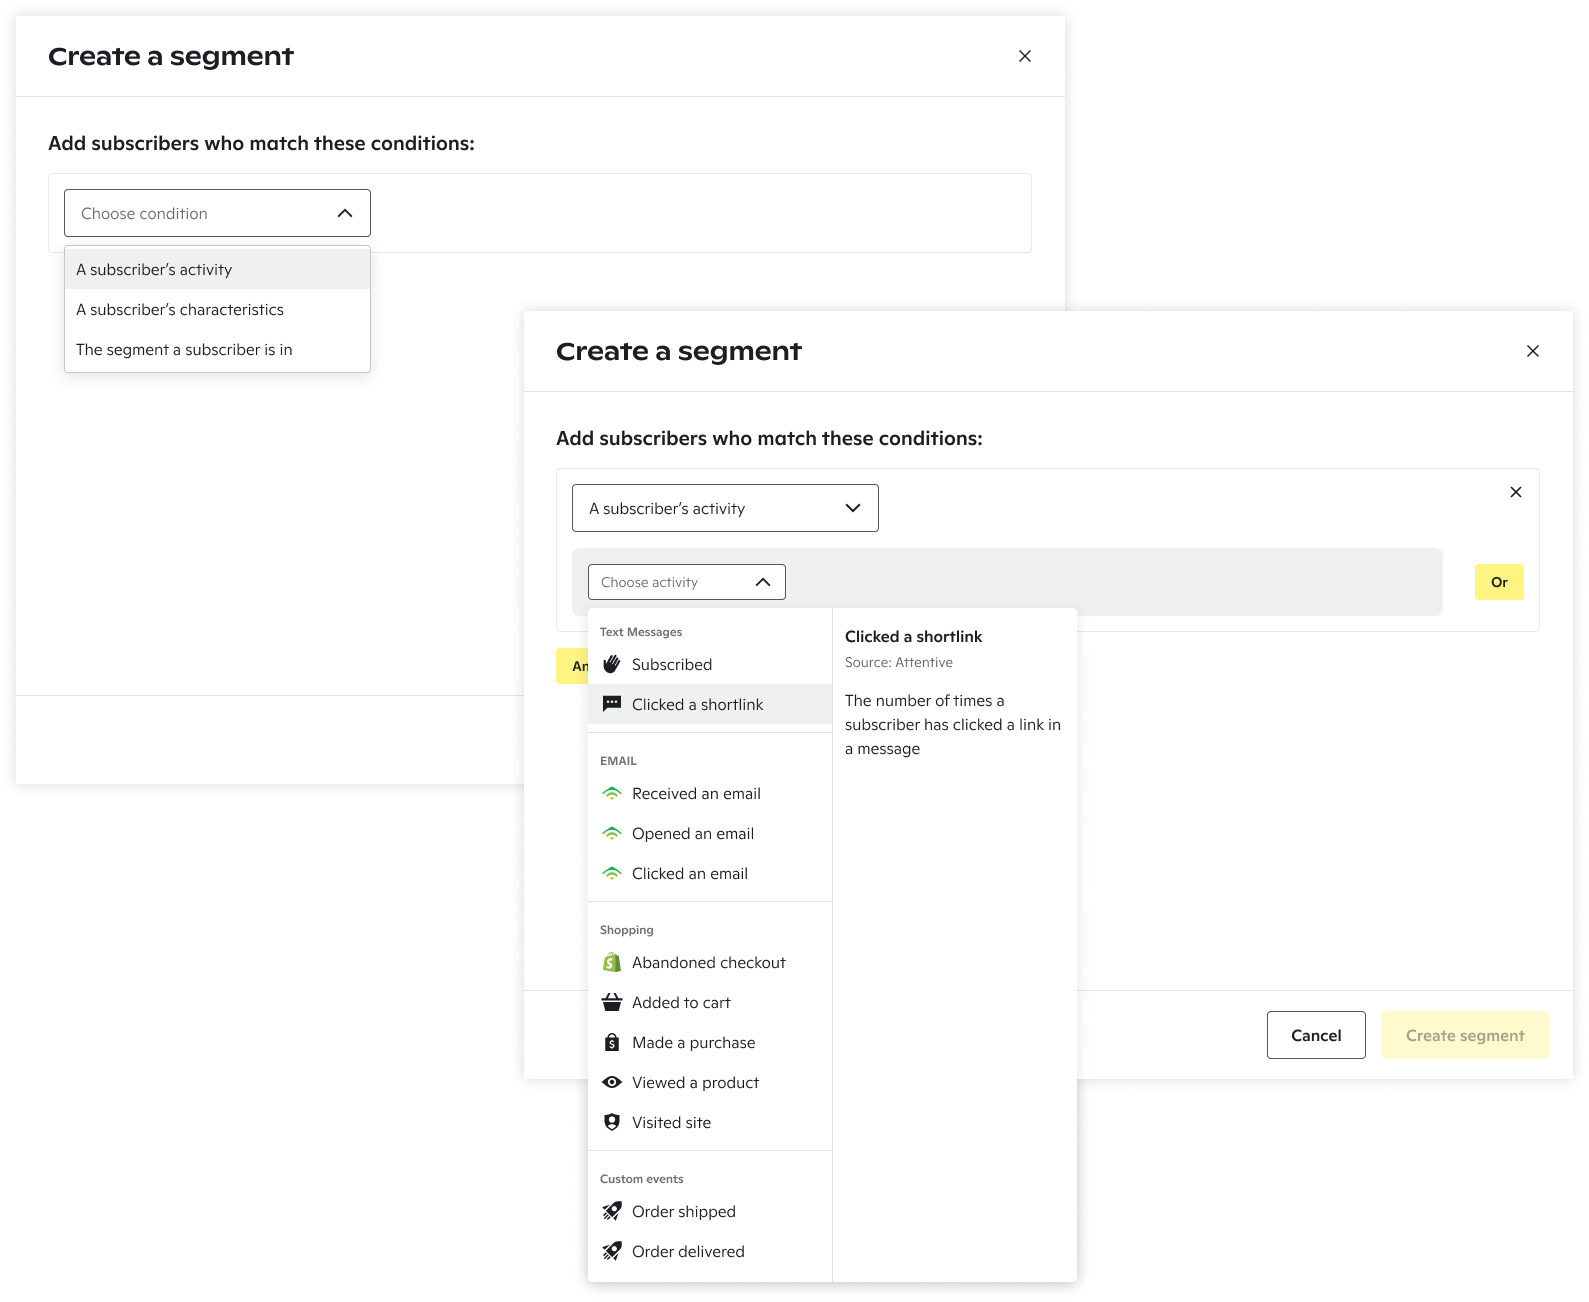
High fidelity designs of the new segment builder IA
Through card sorting, competitive research, and dozens of iterations with content strategy, Jess came up with an intuitive, user friendly framework for organizing and naming different data conditions that would scale to the rest of the product as well as a new interaction design that provided descriptions and sources of different data conditions to users while they were building their segment.
Modularized segment builder
Owner: Kelly Jacobs
Timeline: 3 weeks
This was another simple design project, but a step that was absolutely necessary to unlock the power of our segment builder across our product.
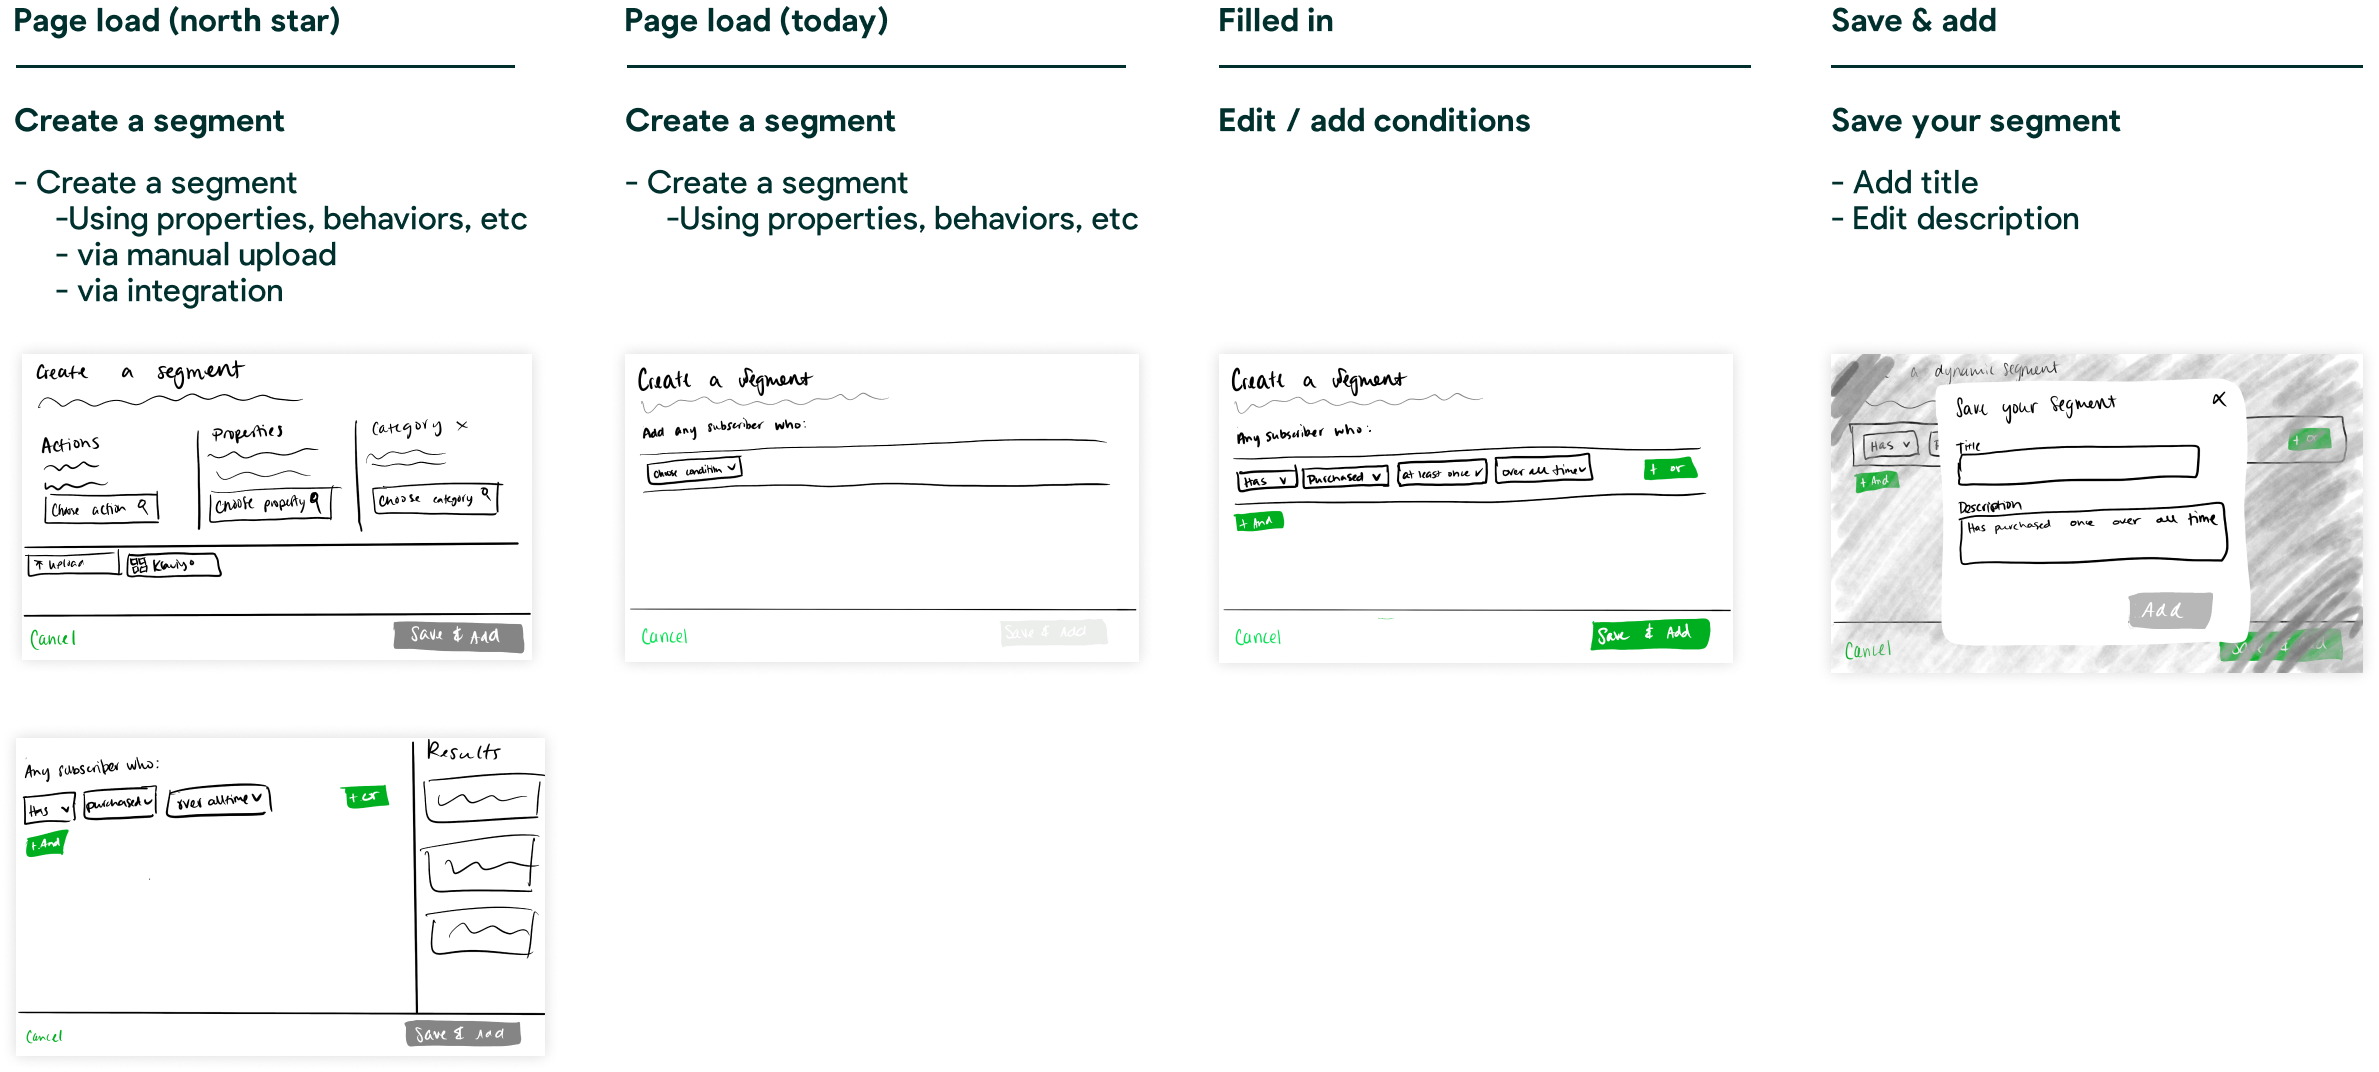
I wanted to remove the 3 steps required to make a segment so that users could immediately start building their query and then decide to save it and name it based on the conditions they entered. By moving towards a full screen modal, this flow could be easily accessed from any flow in our product and provide more room to surface real time results.
Former flow
Proposed flow
Segment size breakdown
Owner: Kelly Jacobs
Timeline: 3 weeks
Size is the most important data point that marketers care about when creating a segment to target a certain set of subscribers with a message. There is usually a tactical problem they are trying to solve (For example, there are 1,000 overstock shirts that need to be sold) and being able to understand the number of subscribers that match a set of conditions is critical. Attentive users will often create a segment just so they can see how big it is, not necessarily so they can send it a message. Showing real time results to users as they create a segment would reduce friction and help users choose segment criteria faster.
Check out a demo of the real time results panel I designed below.
In addition to seeing segment size as you build a dynamic segment, users also needed a stronger understanding of segment size across the other two types of segments offered int he product. In addition to dynamic, real time segments, users can also integrate a segment from a 3rd party and manually upload a CSV with subscribers. Each segment type came with its own set of complexities that would often cause confusion for our users. My goal was to deliver a design framework that would elevate size and recipient count on the details page of a segment, while also providing the right information to users on how each number was calculated. By being transparent about how sizes are calculated, we believed we could build greater trust between users and the product.
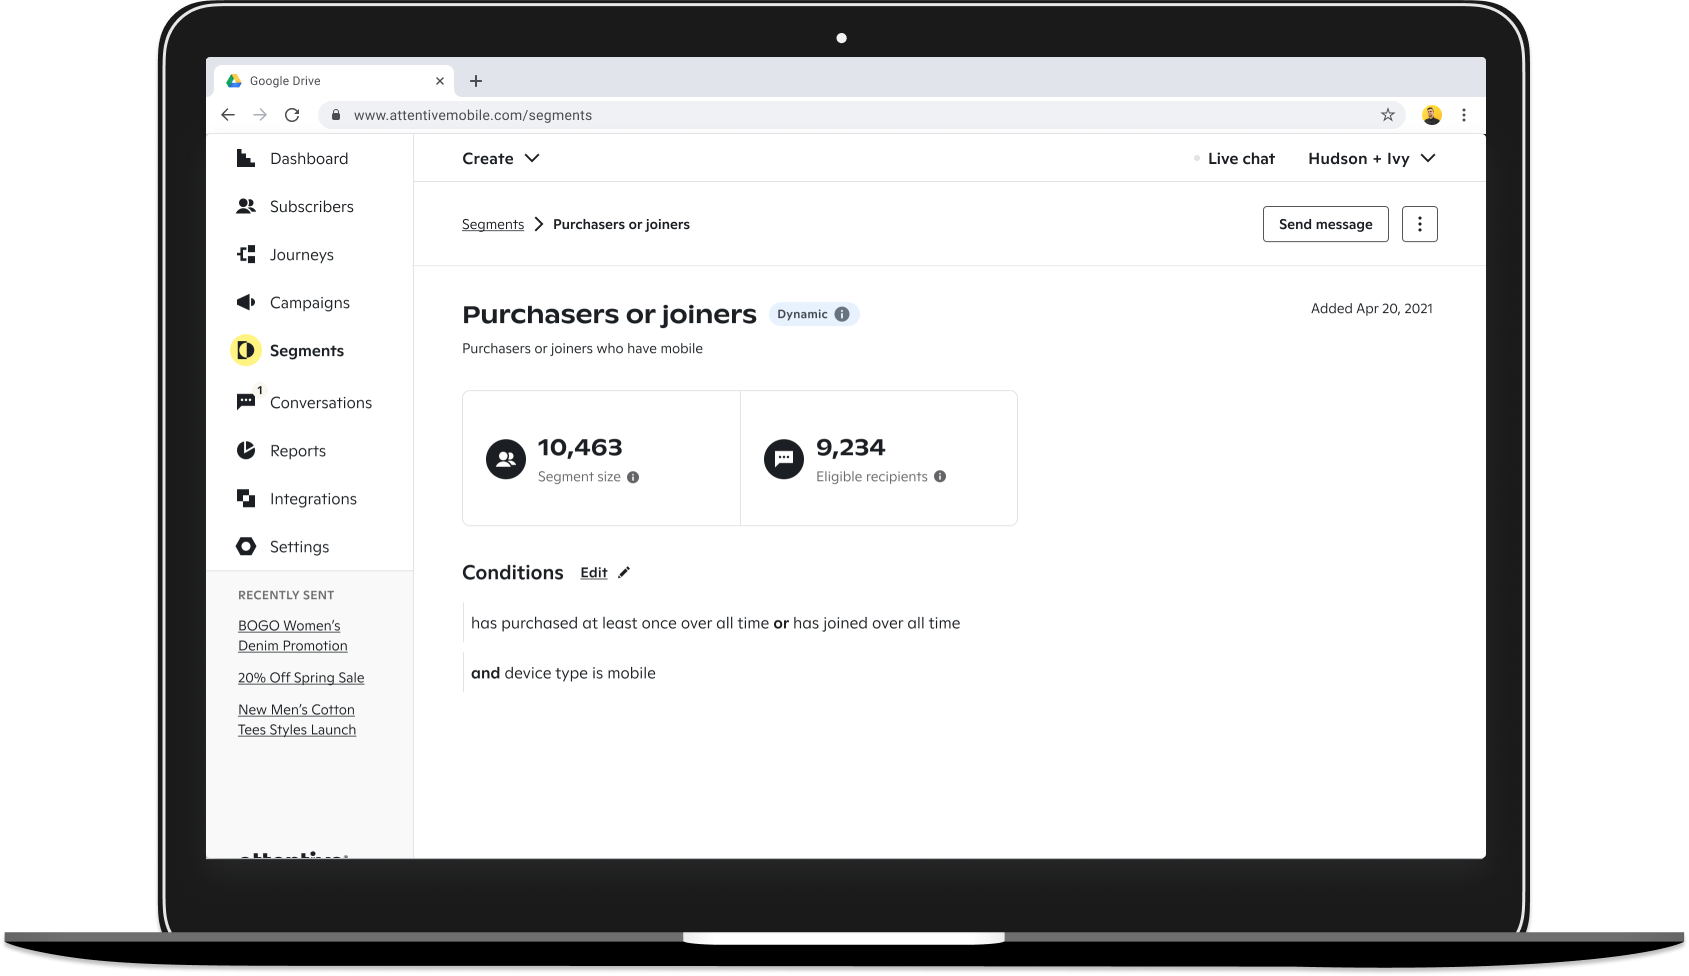
High fidelity design for dynamic segments
Segment history
Owner: Jess Watson
Timeline: 1.5 months for design
Segment history was an iteration of segment size breakdown. While educating users on how sizes are calculated is important, what users really want to know is how and why segments performed when different messages were sent.
By showing performance data trends over time against a history of actions taken on a segment, users could start to decipher which type of content or message frequency was or was not successful with different audiences.
Jess worked closely with our design systems team to develop a trend chart that would scale to other parts of our product and iterated on different layouts that would highlight segment size and performance data in a digestible way.
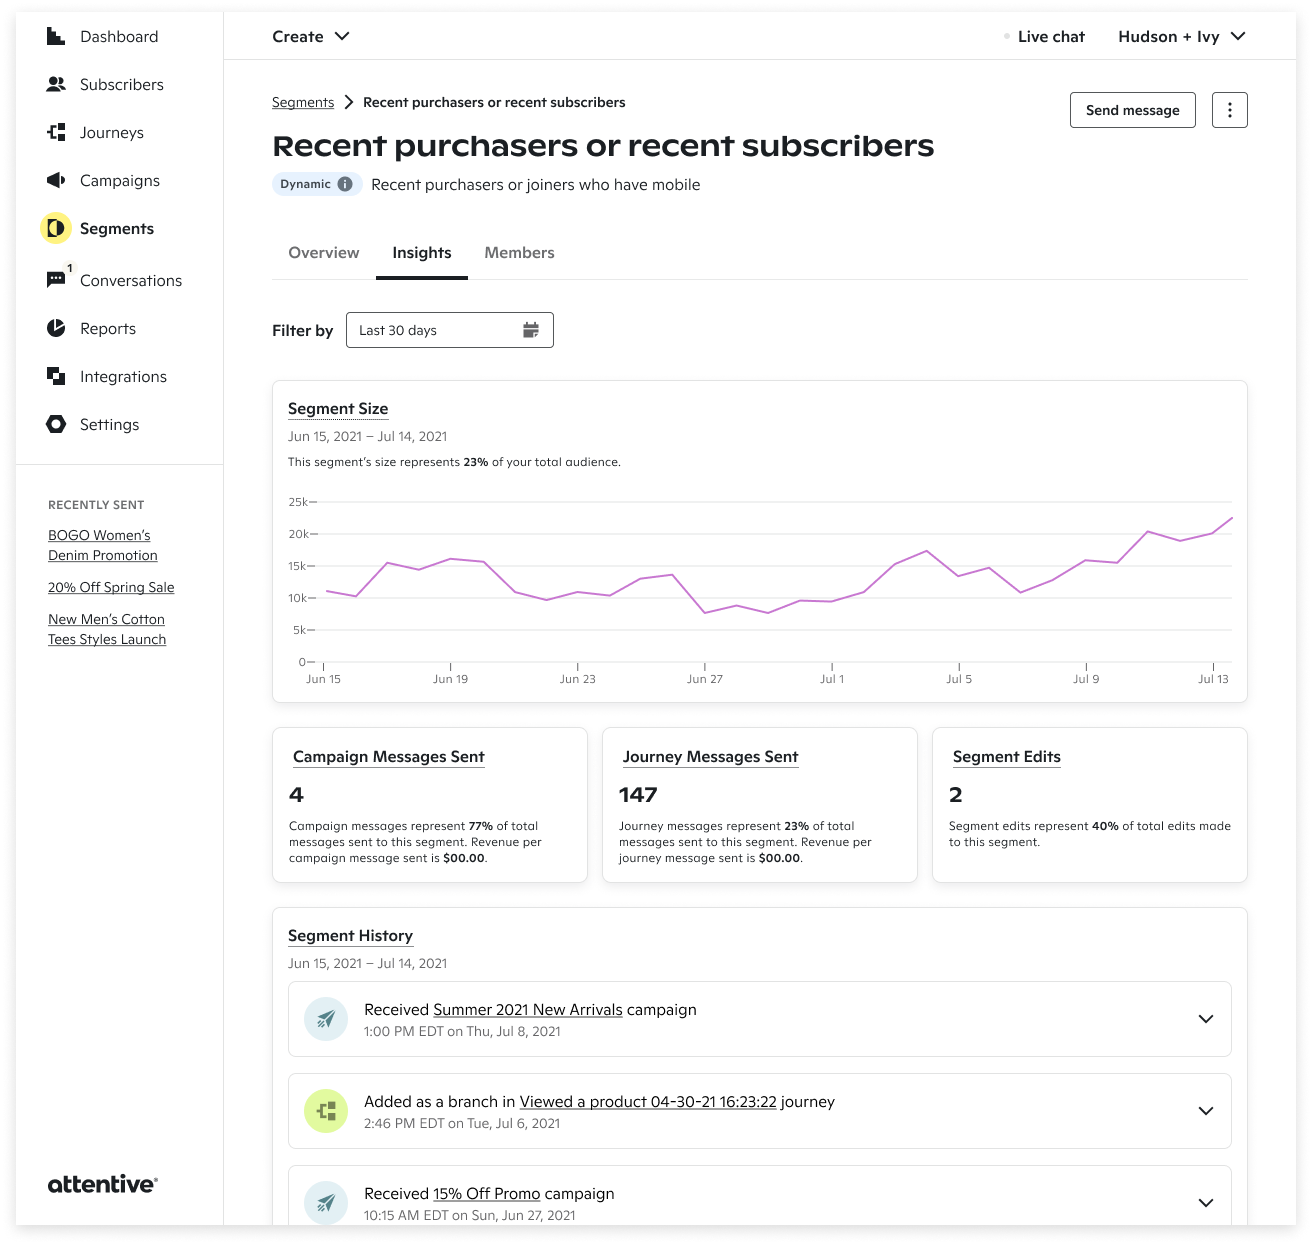
An iteration of segment history that displays performance data over time
Retro
Strong opinions, loosely held
Together, these projects improved the overall experience of segmentation in Attentive. In general, we saw a steady uptick in self-service; more clients were making segments on their own without the help of customer support. From April to June, the number of segments created by clients increased from 53% to 64%.
53%
segments created by clients in April 2021
64%
segments created by clients in June 2021
Jess and I worked through a lot of nitty gritty UX problems while we worked together on Targeting, but as I reflect on this work, some of the most valuable lessons I learned were from my experience coaching and managing above and below me. "Strong opinions, loosely held" is philosophy I've always believed in as a designer and it served me well while working on the Targeting northstar. It means that while I have strong conviction about a hypothesis, I'm also willing to keep an open mind and be proven wrong.
From personal experience as an IC designer, I know that one of the biggest motivation killers is micro-management. If designers want to feel empowered to show up and do their best work, they must be empowered to own their design decisions. This was a focal point for me as I transitioned into a management role. My main goal was to ensure that designers on my team had access to the right tools and processes to make the right design decisions, rather than me just telling them what the design should be.
Conversely, this was also a philosophy that helped me navigate the constant leadership and process changes that make up the environment at a high growth start up. I worked closely with my product partner to identify new and different ways for engaging with leadership to advocate for our ideas and push projects through.
For me, "strong opinions, loosely held" means adopting a growth mindset. It means you are ready and willing to show up and learn something new. It means acknowledging you're not the smartest person in the room, no matter what your title is. These are certainly ideals that I plan on bringing with me to every project.


Interested in working together? Say hi.
Contact
Email: kellyjacobs417@gmail.com
Whatsapp: +01 540 200 5690